Printing from Worldographer
Worldographer doesn’t currently have a built-in print feature. Instead, there are two ways to print that give you a preview and more control over the output of the printed map:
- Export as an Image.
- Export to PDF.
Both options are on the File menu, and both also have a second option (four total) to export just a selected area of the map.
Selecting an Area
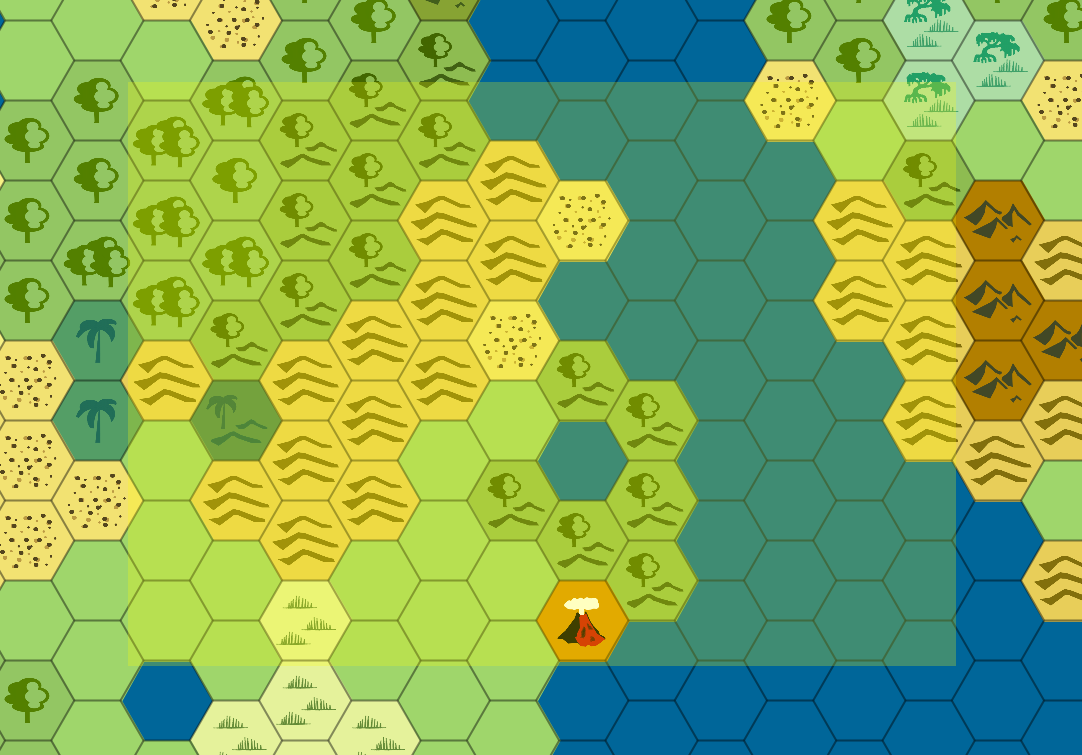
Either option (image or PDF) lets you choose to select an area first. To select an area, go to the Edit menu and click Select Map Area, then press down on the mouse in one corner of the area you want and drag to the opposite corner, then release the mouse button. The area selected is tinted yellow.
Export to Image
This option is a little more powerful than exporting as PDF, but likely requires a bit of experience with an image editor. (We personally use GIMP, but there are many options.) When you pick Export Image (or Exported Selected Area As Image) from the file menu, you’ll be exporting the image at its current size (number of pixels of the map, based on each tile’s number of pixels wide & high) to a PNG image.
A dialog will prompt you for a dpi (dots per inch setting) as well. 300dpi is typical for printing, but you can go higher or lower. Image viewers & editors will usually use this setting and the number of pixels in the image as the default when printing. For example, if you set the image to 300dpi and the image is 3000×2400 pixels, you’ll print the image out as an 10″x8″ image. But most image editors will let you override this as you print so you can tell it the size you want the printed image.
To figure out the number of pixels in the map takes a bit of math. 🙁 For whichever direction on your map has your hexes going flat-side to flat-side (so vertically if your columns line up, horizontally if your rows line up) the math is pretty easy: (number of hexes + one half) x that tile dimension’s size. So if your map is columns line up (flat-side to flat-side is vertical) and you have 100 of them and the tile height is 40 pixels the map height will be: (100 + .5) x 40 = 4020 pixels.
The other dimension of a hex map where the hexes are point to point is harder because of the overlap of the hexes, but it should be: (number of hexes x .75 x that tile dimension’s size) + (that tile dimension’s size x .25). So a map that is 200 hexes wide with the columns lining up (so the hexes are oriented that the points are on the sides) and a width of 46 pixels is: (200 x .75 x 46) + (46 x .25) = 6911 pixels.
Exporting the map as an image also lets you tweak everything about the image that the image editor allows. (Tint it, add extra labels or captions, etc.)
Export to PDF
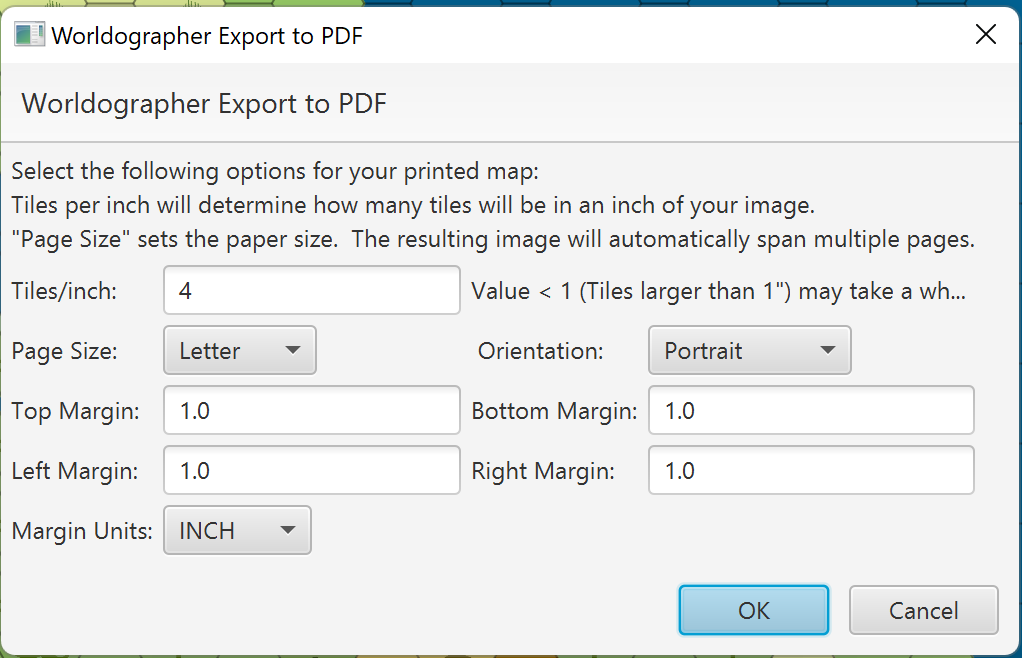
When you select this option, you’ll be asked for a scale of how many hexes per inch you’d like, page size & margins. The program will then create a PDF of your map or the area of the map you’ve selected based on these settings. It will span multiple pages as needed, and you can open the exported PDF to see how it looks.
If you want the map (or selected area) on one page, you can alter the settings after you see the PDF the first time. For example, switch from 4 hexes per inch to 5 hexes per inch. Or make the margin smaller. You can also use the margin to center the map better if it isn’t centered the first time.
Getting the PDF preview is very useful because you can tweak the map’s settings before you print.